How to Calculate Shore Power Emissions Reductions at Berth
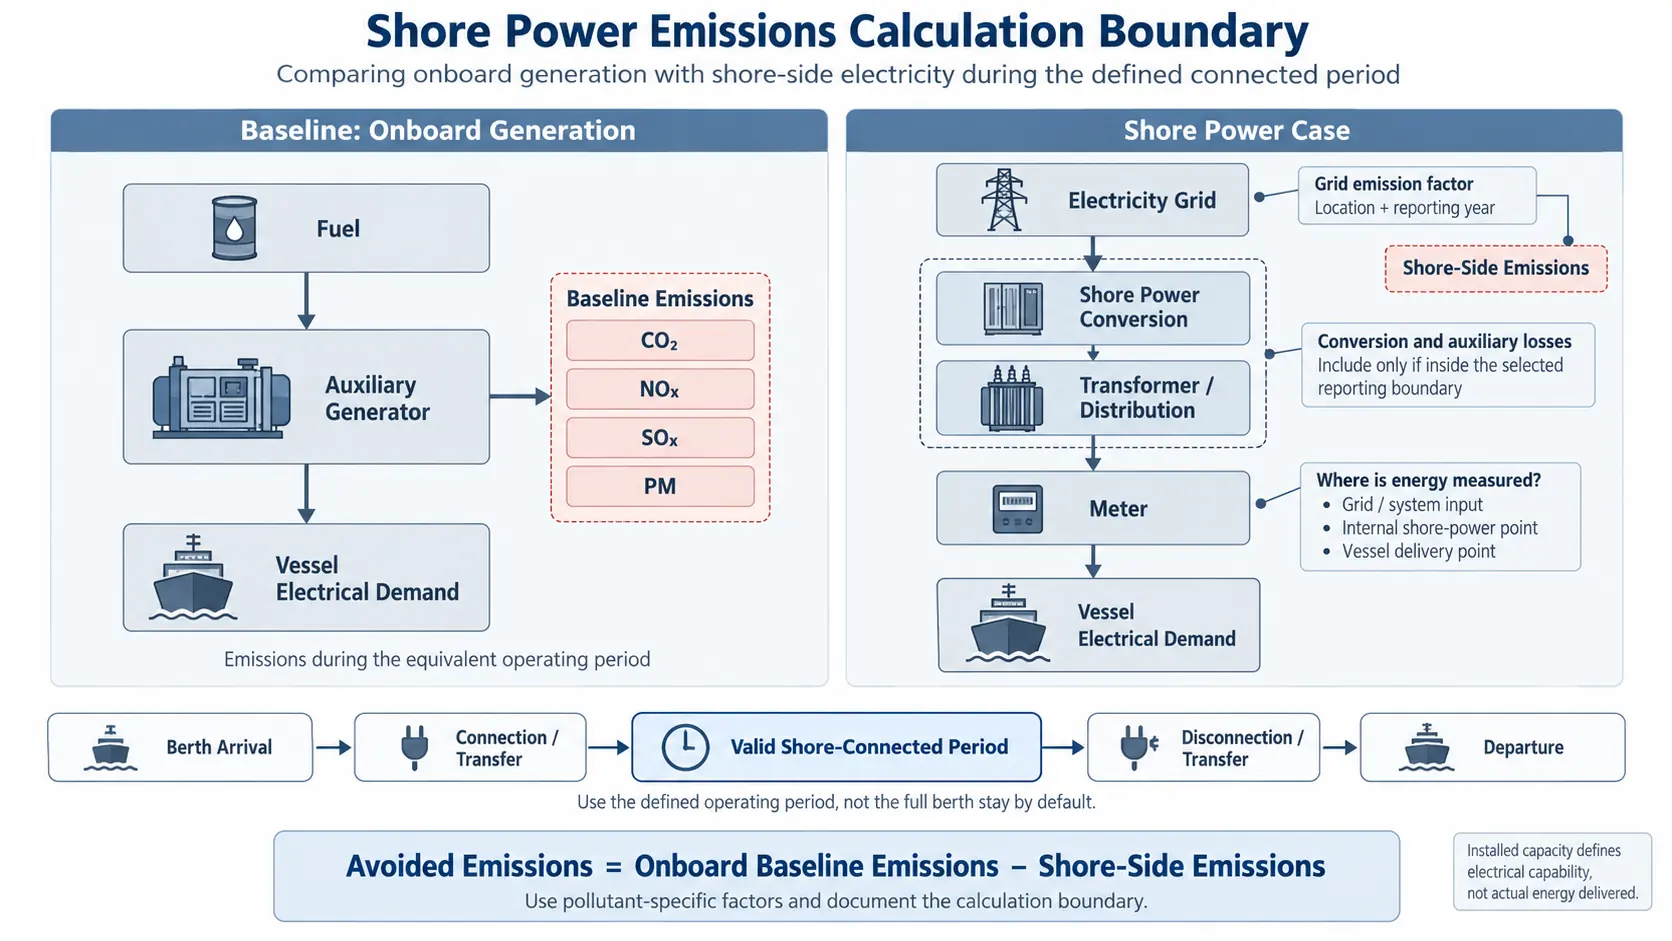
Shore power emissions reduction is the difference between the emissions that would have occurred while a vessel generated electricity onboard and the emissions associated with supplying that electricity from shore during the same operating period.
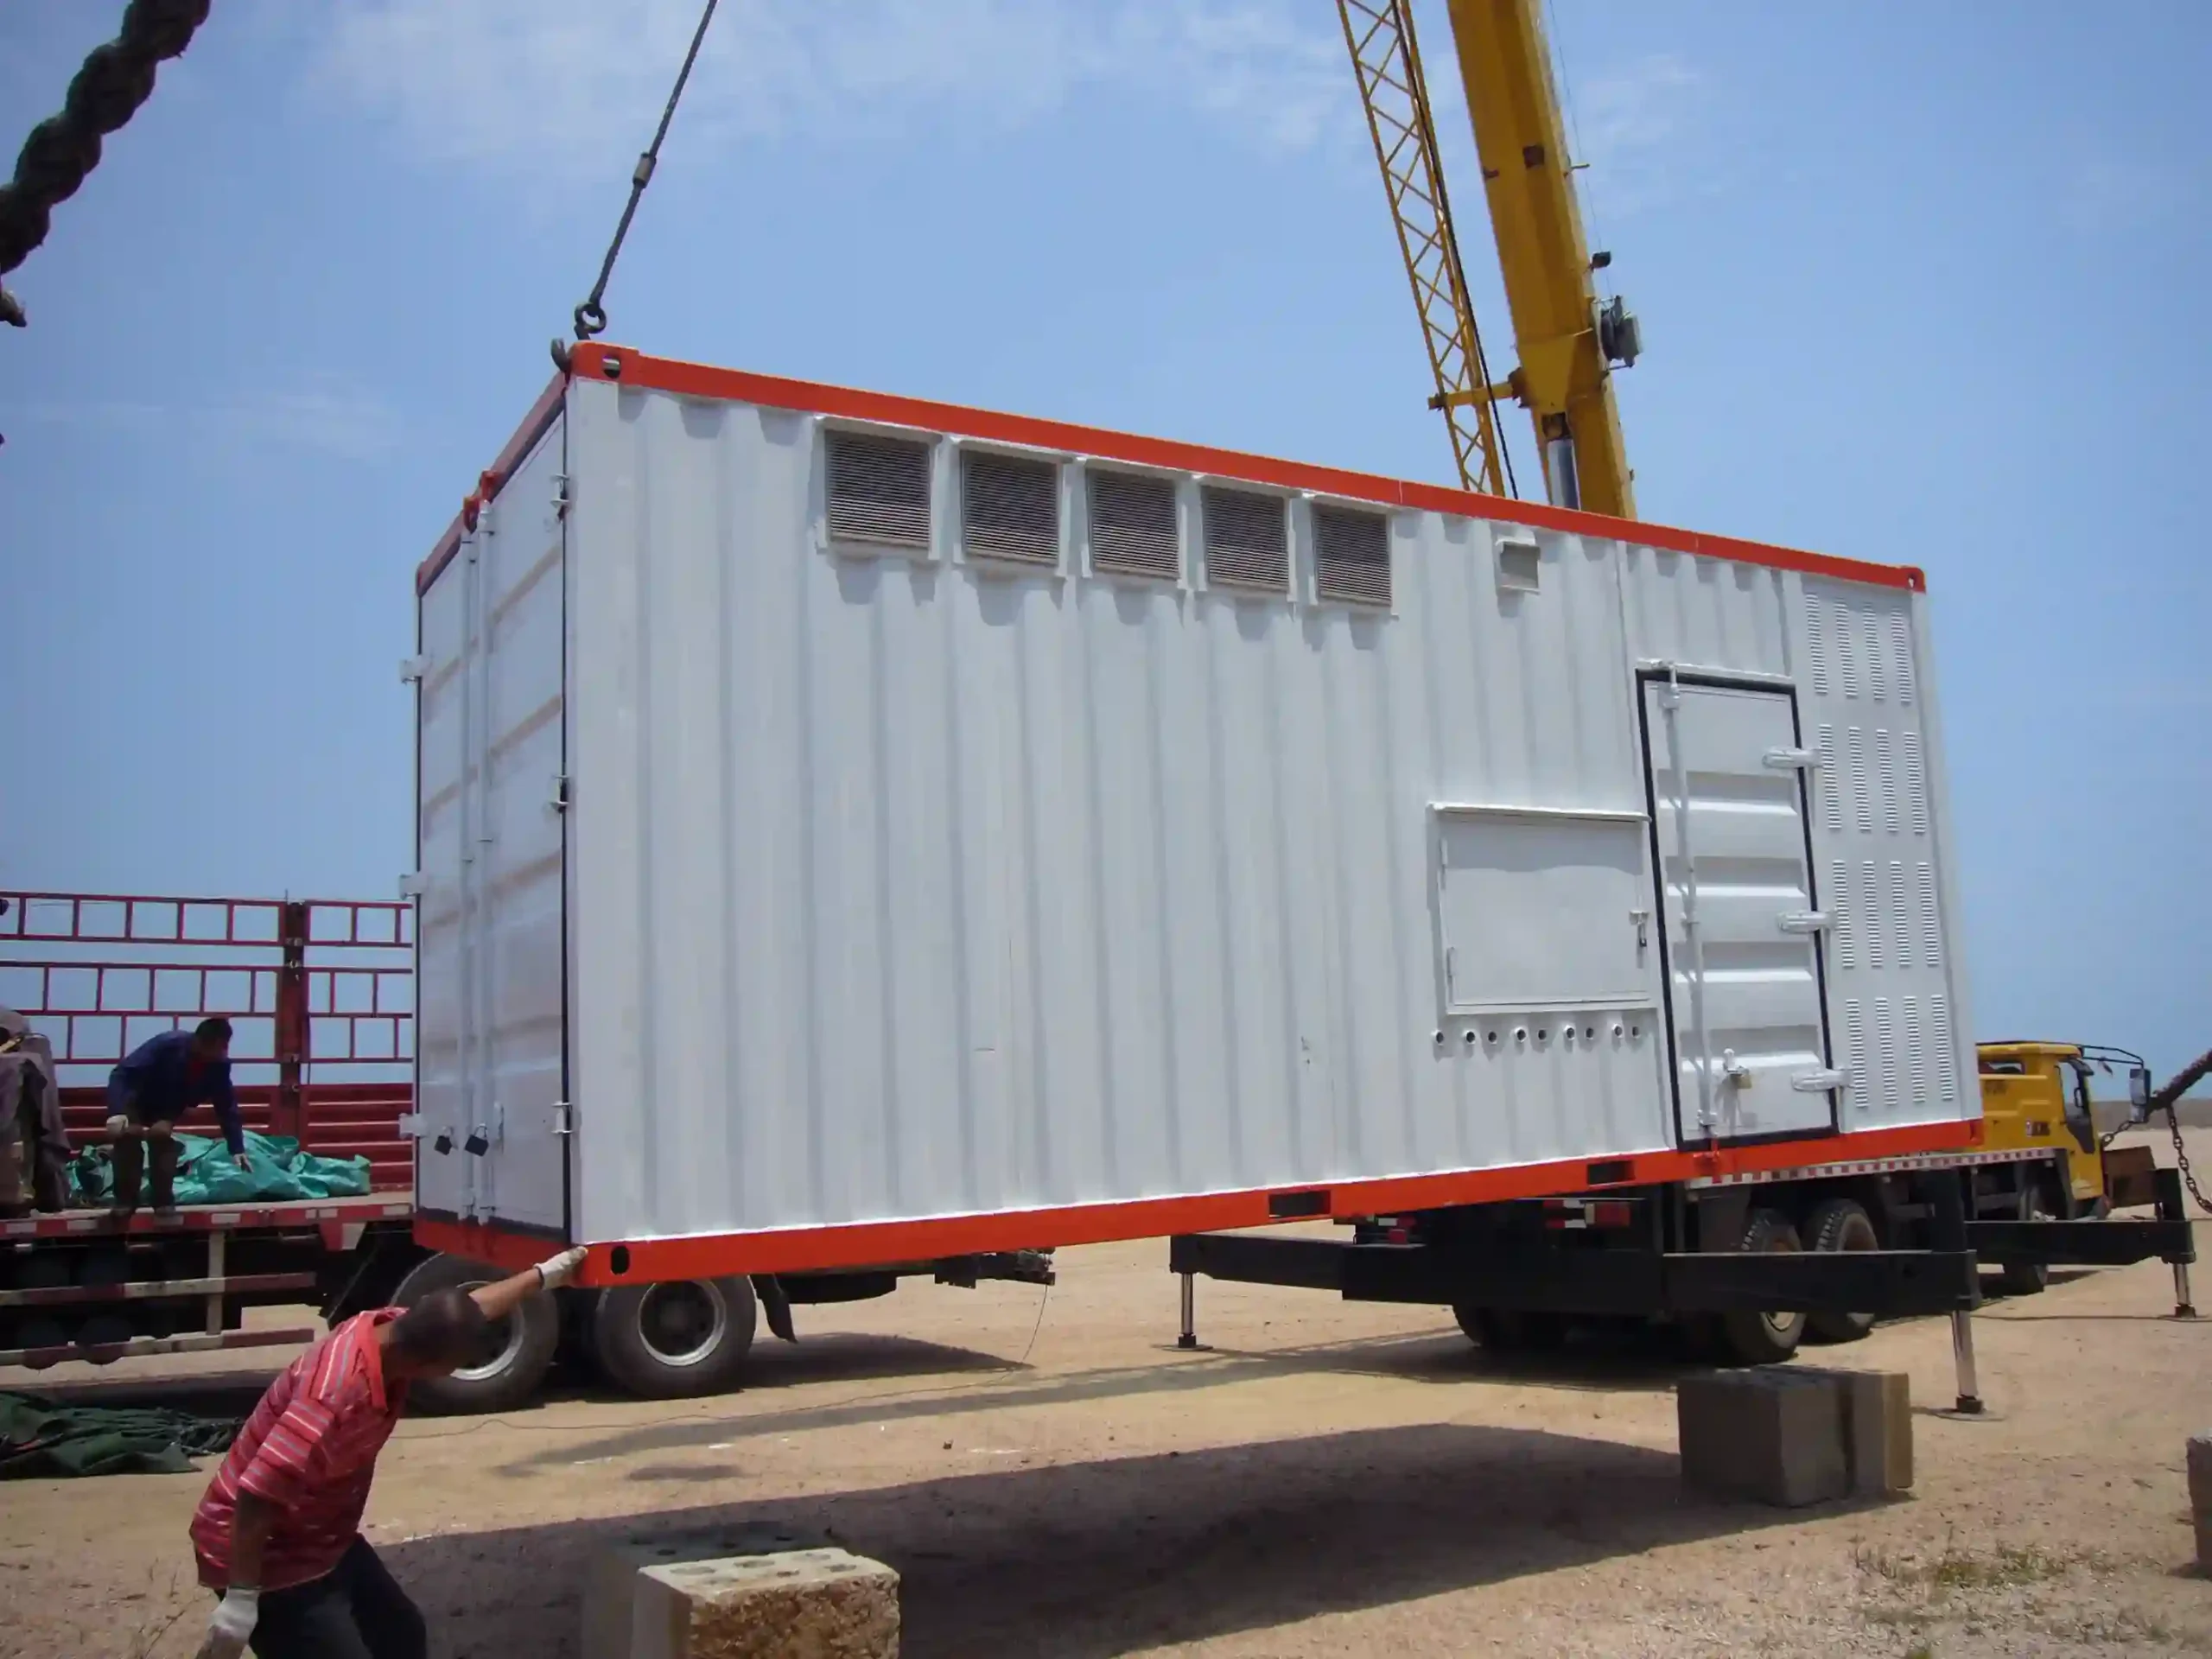
The subtraction is simple. Defining the two sides correctly is not.
A defensible result must state what onboard generation is being displaced, how much electricity the vessel actually received, how long the valid shore-power period lasted, where that electricity was measured, which shore-side losses are included, and which emission factors apply to the vessel and electricity supply.
Installed converter capacity alone cannot provide that result. Neither can total berth time. A 5 MVA shore power system does not operate continuously at 5 MW, and a vessel that remains alongside for ten hours may use shore power for only part of the call.
The calculation therefore begins with the operating and energy boundary, not with a headline reduction percentage.
Start With the Calculation Boundary
Before selecting an emission factor, define which energy flows and emission sources are inside the calculation.
On the vessel side, the main baseline is normally the onboard generation that would have supplied the electrical load if shore power had not been used.
That does not automatically include every emission source on the vessel. Boilers, for example, may continue operating after auxiliary electrical generation has transferred to shore. One or more generators may also remain online during cable connection, synchronization or load transfer.
Those emissions are not avoided merely because shore power is used later in the vessel call.
The shore side requires the same boundary discipline. Electricity can pass through incoming switchgear, frequency conversion, transformers, distribution equipment, cables and auxiliaries before it reaches the vessel. Depending on the reporting method and meter location, some or all of these losses may already be included in the measured shore electricity.
The U.S. EPA's Shore Power Technology Assessment uses the same overall principle: compare emissions produced by the vessel while generating auxiliary power at berth with the emissions associated with supplying shore electricity.[1]
It is: “What onboard activity is being displaced, and what shore-side electrical activity replaces it?”
For the conversion equipment between the utility supply and the vessel interface, see our commercial shore power systems overview.
Two Practical Ways to Build the Onboard Baseline
The available project data determine how the onboard-generation baseline can be established.
Route 1 — Use Electrical Energy
When reliable electrical-demand or energy data are available, the baseline can be expressed in terms of the electrical activity that would otherwise have been supplied by onboard auxiliary generation.
- vessel-call records;
- actual connected time;
- metered shore energy;
- known vessel electrical profiles; and
- a defined meter boundary.
This route is particularly useful for operating shore power installations where actual kWh and connection records already exist.
Route 2 — Reconstruct From Engine Activity
Where reliable historical shore-energy data do not yet exist, the baseline can be built from the auxiliary-engine operating case.
- auxiliary-engine operating power;
- operating mode and load;
- operating duration;
- engine characteristics;
- fuel and sulfur information; and
- pollutant-specific emission factors.
Both routes ultimately answer the same question: how much onboard generation was actually displaced during the valid shore-connected period?
Installed generator capacity, converter rating or total berth duration are not substitutes for that activity.
Define the Shore-Side Energy Boundary
A kWh value becomes useful only when the measurement point is known.
| Meter location | What the reading may include | Engineering question |
|---|---|---|
| Grid or system input | Conversion losses and some shore-side auxiliaries may already be included. | Does the reading represent total electricity drawn to provide shore service? |
| Internal shore power point | Only a selected part of the conversion and distribution chain may be represented. | How does the meter location relate to the single-line diagram? |
| Shore output or vessel delivery | Upstream converter, transformer, cable and auxiliary consumption may be outside the reading. | Do those upstream loads belong inside the reporting boundary? |
Why Dual-Side Metering Can Be Valuable
In one shore power engineering configuration documented in project records, energy metering was specified at both the 10 kV input and low-voltage output sides of the shore power system.
The same project documentation also required metered data to support monitoring and billing.
When input and output energy records are both available, they can help distinguish electricity drawn by the shore-side system from electricity delivered toward the vessel.
The engineering task is therefore to map each meter to the single-line diagram before the data are used in the emissions calculation.
Use a Transparent Calculation Structure
For each pollutant, the basic relationship is:
A simplified energy-based CO₂ calculation can be expressed as:
Every term should have a documented source.
Baseline Side
- vessel or vessel class;
- operating mode;
- load or electrical energy;
- fuel;
- engine characteristics;
- emission-factor source; and
- operating period.
Shore Side
- measured or modeled electricity;
- meter location;
- included losses and auxiliaries;
- grid or supplier factor;
- geographic scope; and
- factor year.
That turns the result from a marketing number into a calculation that another engineer can reproduce.
A Real Operating Record Shows Why Activity Data Matter
A historical shore power project record provides a useful example of the difference between installed capacity and actual operation.
Worked operating-data example
During two vessel connections, the onboard generator load at transfer was recorded at approximately 1,500 kW. The control system transferred the load to shore power and the onboard generator was then removed from service. Across the two connections, approximately 6.5 hours of shore-power operation and 9,981 kWh of vessel electrical use were recorded.
These figures are valuable because they describe an actual operating event rather than a nameplate capacity.
But they still do not provide a complete emissions answer by themselves.
To reconstruct CO₂, NOx, SOx or particulate-matter reductions for those connections, the calculation would also need the applicable:
- auxiliary-engine emission factors;
- engine and fuel conditions;
- grid electricity factor and reporting year;
- meter location;
- shore-side loss boundary;
- boiler operating condition; and
- accounting method.
Use Actual Connected Energy and Time
For an operating shore power installation, each vessel call should ideally preserve a traceable operating record.
Useful fields include:
- vessel or approved vessel profile;
- berth;
- connection start;
- transfer completion;
- valid shore-connected period;
- disconnection;
- shore energy;
- relevant voltage and frequency mode;
- meter identity; and
- abnormal or incomplete connection events.
If a vessel remains at berth for eight hours but uses shore power for six, the full eight hours should not automatically be treated as avoided onboard-generation time.
The same applies to a connection that is delayed, aborted or interrupted.
Calculate Each Pollutant Separately
CO₂, NOx, sulfur oxides and particulate matter do not share one universal reduction percentage.
On the vessel side, their factors can depend on engine type, engine age, operating load, fuel, sulfur content, emissions-control technology and after-treatment.
On the shore side, the emissions profile depends on the electricity-generation mix and the accounting framework.
EPA's Port Emissions Inventory Guidance provides pollutant-specific treatment for marine engines rather than deriving all pollutants from one CO₂ percentage.[2]
For greenhouse-gas reporting, the required metric may also be CO₂e rather than CO₂ alone. The reporting framework should decide which gases are included.
What Historical Project Records Can Prove
Long-term operating records can show whether a shore power system moved beyond commissioning and became part of recurring vessel service.
One historical record available in the engineering source material documents nearly 80 shore power connections, more than 2,000,000 kWh supplied, and historical project estimates of approximately:
- 1,600 tonnes CO₂;
- 20 tonnes NOx;
- 20 tonnes SO₂; and
- 0.5 tonnes particulate matter.
Those figures are valuable project evidence. They show that actual connection activity and cumulative electrical energy were being tracked and that environmental performance was being quantified.
They are not, however, universal shore power conversion factors.
The record alone does not preserve enough information in the same passage to independently reconstruct the engine factors used, grid factor and year, boiler treatment, shore-side losses, all assumptions or the complete calculation workbook.
It is: preserve operating energy and the calculation method together.
Audit a Historical Emissions Claim Before Reusing It
1. What Was the Activity Data?
Was the result based on metered kWh, engine load and operating hours, modeled vessel demand or installed capacity? These do not provide the same confidence.
2. What Exactly Was Displaced?
Identify the onboard generators and operating period represented by the baseline. Do not assume that all onboard emission sources stopped.
3. Which Factors Were Used?
Preserve the organization, dataset, version, year, engine or vessel applicability and electricity-region scope.
4. Where Was Shore Electricity Measured?
A shore-system input reading and a vessel-delivery reading do not have the same loss boundary.
5. Can Another Engineer Reproduce the Result?
A robust record should allow the result to be recreated from activity data + factor set + boundary + calculation workbook.
If one of those elements is missing, the historical figure should be described with the appropriate limitation rather than silently converted into a current project factor.
Know What Each Data Point Can Prove
| Data item | What it can support | What it cannot establish by itself |
|---|---|---|
| Connected hours | Duration of valid shore operation | Actual vessel electrical demand |
| Metered kWh | Electrical activity within that meter boundary | Complete shore-side consumption if the meter boundary is unknown |
| Vessel load | Demand at the stated operating point | Total energy over the complete vessel call |
| Shore power MVA | Maximum electrical capability | Actual energy delivered or emissions avoided |
| Grid factor | Electricity-side emissions for its defined region/year | Vessel baseline emissions |
| Engine factor | Onboard emission intensity for the defined engine/fuel condition | Shore electricity emissions |
| Historical reduction figure | A project calculation or estimate existed | A universal shore power emission factor |
This distinction matters because many apparently precise emissions claims are built from data with very different evidentiary strength.
Control Data Quality and Uncertainty
Not every calculation starts with measured vessel data. A practical hierarchy is:
| Data level | Typical basis | Reporting implication |
|---|---|---|
| Measured operational data | Metered electricity, connection timestamps, vessel-specific operating records | Strongest activity evidence when the boundaries are known |
| Vessel-specific modeled data | Known engine and vessel information without complete direct measurement | State model inputs and assumptions |
| Official default factors | Recognized datasets filling defined information gaps | Retain source, version, scope and year |
| General assumptions | Early feasibility inputs | Use wider uncertainty and less numerical precision |
If auxiliary-engine load, connected time, shore losses or emission factors remain uncertain, calculate how the result changes across credible input values instead of hiding the uncertainty inside one exact number.
The precision of the published result should reflect the precision of the underlying evidence.
Keep Grid Factors Local and Dated
Electricity emissions are location- and time-dependent.
For U.S. calculations, EPA eGRID provides regional electricity-generation and emissions data. EPA currently publishes eGRID2023 and its summary data include regional output emission rates for CO₂, NOx and SO₂, among other metrics.[3]
That does not mean eGRID is the correct source for every project. Another jurisdiction or reporting program may prescribe a national factor, regional factor, supplier-specific factor, market-based accounting method or another approved dataset.
Record the answer with the calculation. Do not silently replace the factor used in a historical result with a newer value and still present the result as though nothing changed.
Onsite Zero Exhaust Is Not Zero System Emissions
Shore power can eliminate the local exhaust from auxiliary generators that are actually shut down during the valid shore-connected period.
That distinction is important for air quality around the berth. It does not automatically mean the supplied electricity has zero emissions.
EPA's shore power assessment compares vessel-side emissions with the emissions associated with generating the electricity used for shore power.[1]
The public claim should therefore match the boundary. A technically defensible statement may be “local auxiliary-generator exhaust was avoided during the valid shore-connected period” rather than “the vessel operated with zero emissions” unless a broader accounting method supports that conclusion.
Keep Policy Requirements Separate From Emissions Results
A regulatory shore power requirement can influence infrastructure deployment without proving a specific environmental result.
Compliance dates, covered vessel categories and port thresholds should therefore be treated separately from the emissions calculation.
The emissions result still depends on actual vessel activity, connection duration, electricity delivered, vessel baseline and the relevant factor set.
For wider policy and technical-standard requirements, see our shore power standards and compliance page.
Common Shore Power Emissions-Calculation Errors
| Error | Why it matters |
|---|---|
| Using installed converter capacity as energy consumption | The rating describes capability, not delivered energy. |
| Using the full berth stay as connected time | Transfer delays, early disconnection and failed connections can reduce the valid shore-power period. |
| Using one generic vessel factor | Engine, fuel and load conditions vary. |
| Ignoring meter location | Input-side and output-side kWh can represent different system boundaries. |
| Ignoring shore-side losses and auxiliaries | This can overstate avoided emissions where those loads belong inside the selected boundary. |
| Calling shore electricity zero-emission because no exhaust is visible at the berth | Upstream electricity emissions require an explicit treatment. |
| Applying a CO₂ reduction percentage to NOx, SOx and PM | Each pollutant requires its own factor set. |
| Reusing an old project reduction without its method | A historical result cannot automatically become a current emission factor. |
| Reporting more precision than the inputs support | Generalized engine factors and modeled loads do not justify kilogram-level certainty. |
Information Needed for a Project Calculation
- vessel types and calling pattern;
- auxiliary-engine configuration;
- berth electrical demand;
- fuel and engine information;
- berth duration;
- valid shore-connected period;
- metered shore energy;
- meter location;
- input and output metering where available;
- converter, transformer and auxiliary-loss boundary;
- electricity emission-factor source and year;
- pollutants to be reported;
- boiler treatment;
- transfer-period treatment;
- required reporting framework; and
- known data uncertainties.
These inputs should be defined early enough that the operating and metering system can preserve the evidence required for later reporting.
Frequently Asked Questions
Does shore power eliminate all emissions from a vessel at berth?
No. It can eliminate the local exhaust from auxiliary generators that are actually displaced during the connected period. Boilers, other onboard sources and electricity-generation emissions may remain.
Can shore power emissions reduction be calculated from converter capacity?
No. Installed capacity defines the maximum electrical capability of the system. Emissions reduction depends on actual or appropriately modeled activity, connected time and emission factors.
Is metered kWh enough to calculate the reduction?
Not by itself. You also need to know where the meter is located, what onboard generation was displaced, which emission factors apply and which losses are inside the calculation boundary.
Why would both input and output meters be useful?
They can help distinguish the electricity drawn by the shore-side system from the electricity delivered toward the vessel. The difference must still be interpreted using the actual equipment and auxiliary boundary.
Which electricity emission factor should be used?
Use the factor required by the applicable location, reporting year and reporting framework, and preserve the source and version.
Can the same reduction percentage be used for CO₂, NOx, SOx and PM?
No. Each pollutant requires its own baseline and shore-side factors.
What if vessel-specific data are incomplete?
Use an appropriate recognized model or official default factor, state the assumption, and reflect the additional uncertainty in the reported result.
Technical References
- U.S. Environmental Protection Agency, Shore Power Technology Assessment at U.S. Ports — 2022 Update. Official EPA source.
- U.S. Environmental Protection Agency, Port Emissions Inventory Guidance: Methodologies for Estimating Port-Related and Goods Movement Mobile Source Emissions, April 2022. Official EPA source.
- U.S. Environmental Protection Agency, eGRID Summary Data — eGRID2023. Official EPA source.
Build the Calculation From Evidence That Can Be Reproduced
A credible shore power emissions result should survive a simple test: could another engineer reproduce it from the retained records?
That requires more than a converter rating or annual kWh total. It requires a defined vessel baseline, actual or modeled operating activity, a known meter boundary, applicable factor versions, clearly treated losses and a calculation record that connects those inputs to the published result.
Send the vessel profile, electrical demand, berth and connected hours, metered energy, meter locations, fuel and engine information, shore-system boundary and applicable electricity factor.
Send Your Shore Power Project Data